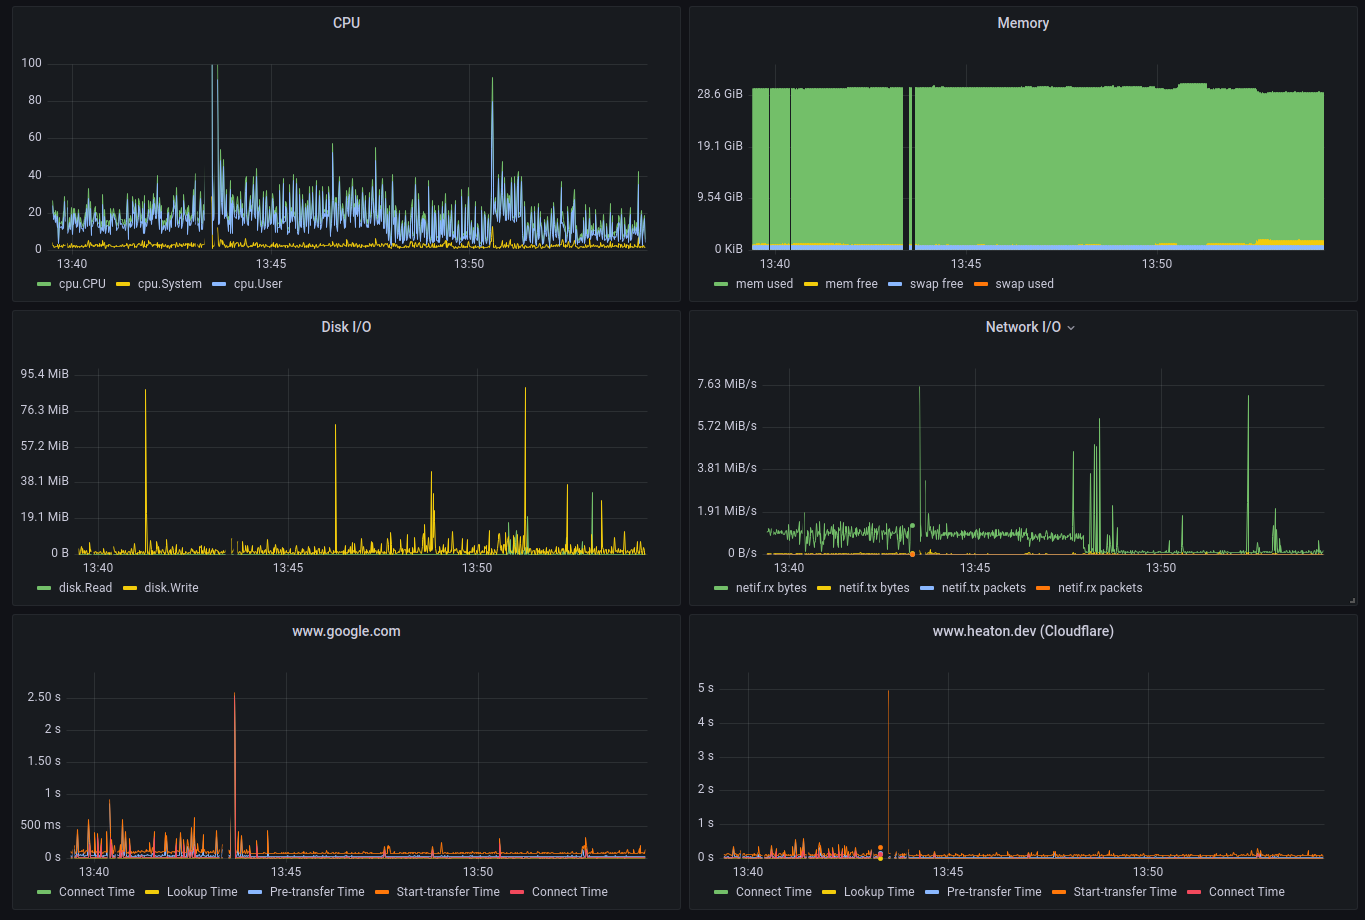
I want to keep an eye on my Internet service provider after a series of prolonged outages, to that end I setup a Grafana dashboard to monitor my connectivity to various online services.
Luckily the modern Internet isn’t too fussed when you act like a robot, connecting and downloading a page every few seconds for days on end. That sort of behaviour would get your IP blacklisted a decade ago.
My methodology is quite simple, connect and download a webpage every few seconds. I could ping, but that wouldn’t reveal DNS issues, I could stop the test when a connection is established, but that wouldn’t reveal bandwidth issues.
The config for fluent is very simple, we use the exec plugin to run a curl command and parse the output as JSON. We then tag the result to enable filtering in Grafana.
[INPUT]
    Name          exec
    Tag           exec_heaton_dev
    Command       curl -s -w '{"Protocol":"%{scheme}","address":"%{url_effective}","Remote IP":"%{remote_ip}","Lookup Time":%{time_namelookup},"Connect Time":%{time_connect},"Pre-transfer Time":%{time_pretransfer},"Start-transfer Time":%{time_starttransfer},"Total Time":%{time_total},"Download Size":%{size_download}}\n' -o /dev/null https://www.heaton.dev
    Parser        json
    Interval_Sec  5
    Interval_NSec 0
    Buf_Size      8mb
Let’s breakdown this curl command:
{
    "Protocol": "%{scheme}",        // http/https
    "address": "%{url_effective}",  // example.com
    "Remote IP": "%{remote_ip}",    // IPv4/IPv6
    "Lookup Time": %{time_namelookup},  // Time to resolve the DNS address example.com
    "Connect Time": %{time_connect},    // Time to connect to example.com
    "Pre-transfer Time": %{time_pretransfer},       // Time since start until file transfer ready
    "Start-transfer Time": %{time_starttransfer},   // Time since start until file transfer begins, includes Pre-transfer Time
    "Total Time": %{time_total},                    //
    "Download Size": %{size_download}               // Bytes downloaded
}